Environment
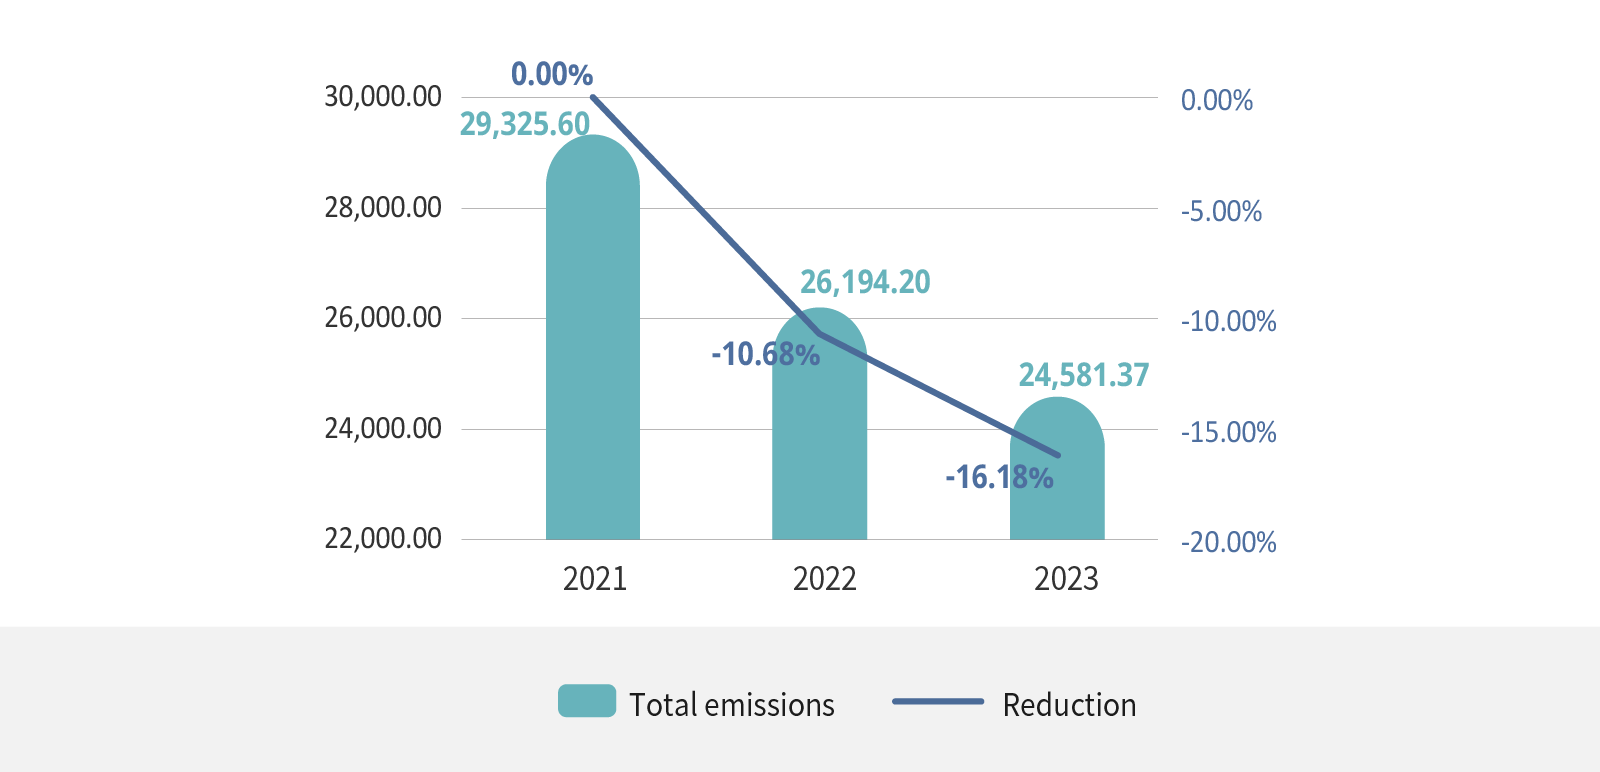
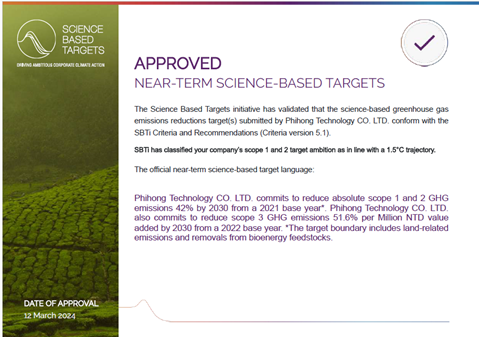
Phihong deeply recognizes the importance of Earth's resources and sustainable development. The company actively promotes environmental management systems and aligns with global carbon reduction trends. Using 2021 as the baseline year, Phihong aims to achieve a 42% reduction in carbon emissions (Scope 1+2) by 2030, working toward net-zero emissions by 2050.
Greenhouse Gas & Energy Management
To implement energy conservation and carbon reduction measures while fully disclosing corporate carbon emissions and reduction information, Phihong adheres to ISO 14064-1:2018 for Scope 1+2 greenhouse gas inventory operations. Organizational boundaries are established based on operational control principles, with the baseline year set as 2021 for calculating and verifying greenhouse gas emissions. In compliance with the Financial Supervisory Commission (FSC) requirements, Phihong progressively includes subsidiaries, major production sites, and offices within the inventory scope, aiming to achieve 100% site coverage by 2025 and verification by 2026. Furthermore, based on significance identification results, Scope 3 inventory scope is expanded beyond established inventory items such as waste and energy consumption to include business travel and employee commuting.
| Emission category / year | Phihong Group | |||
| 2021 | 2022 | 2023 | Versus base year (2021) | |
| Category 1 - Direct emissions | 612.6 | 906.0500 | 727.7034 | 18.80% |
| Category 2 - Indirect emissions | 28,713.1 | 25,133.9687 | 23,853.6698 | -16.92% |
| Total emissions | 29,325.6 | 26,040.0187 | 24,581.3732 | -16.18% |
| Emission intensity (T-CO2e/ millions of revenue) | 2.39 | 1.8064 | 1.9932 | -16.51% |
Note: The 2023 GWP values are sourced from IPCC AR6. Electricity factors used are as follows: Taiwan region uses the Ministry of Economic Affairs, Energy Bureau announced electricity factor of 0.4950 ton-CO2e per kWh for the year 111. Dongguan region uses China’s Environmental Climate Bulletin (2023) No. 43 electricity factor of 0.5703 ton-CO2e per kWh. Phihong in Vietnam uses Vietnam’s Ministry of Natural Resources and Environment, Climate Change Department’s 2021 electricity coefficient report (p.18) electricity coefficient of 0.7221 ton-CO2e per kWh.
Unit: t CO2e
| Statistics of greenhouse gas emission types in 2023 (category 1) | ||||||||
| Types | CO2 | CH4 | N2O | HFCs | PFCs | SF6 | NF3 | 總計 |
| Emissions | 69.6904 | 609.8426 | 0.6764 | 47.4940 | 0.00 | 0.00 | 0.00 | 662.7954 |
| Percentage % | 9.58% | 83.80% | 0.09% | 6.53% | 0.00% | 0.00% | 0.00% | 100.00% |

| Linkou HQ | Zerova | Dongguan | Haiphong | Total emission | ||
| Category 1 (Direct) | Fixed burning | 0.0000 | 0.1737 | 0.0000 | 2.5998 | 2.7735 |
| Mobile burning | 7.6923 | 7.8699 | 39.4186 | 11.7800 | 66.7608 | |
| Process emissions | 0.0025 | 0.0001 | 0.3430 | 0.2659 | 0.6115 | |
| Fugitive emissions | 100% 回收利用 | 24.7574 | 391.8434 | 209.3615 | 657.5576 | |
| Total | 39.2901 | 32.8011 | 431.6050 | 224.0072 | 727.7034 | |
| Category 2 (Indirect) | Purchased electricity | 764.9948 | 917.0820 | 12,325.2945 | 9,846.2985 | 23,853.6698 |
| Total emissions | 804.2849 | 949.8831 | 12,756.8995 | 10,070.3057 | 24,581.3732 | |
| Emission sources | Description | 2022 (Base year) | 2023 | Versus base year | |
| Category 3 (Transport) | Business travel | Includes car, high speed rail, air | 169.0952 | 201.4096 | -19.11% |
| Employee commuting | Includes motorcycles, cars, buses, metro, etc. | 690.2332 | 695.6473 | 0.78% | |
| Category 4 (Organizational use) | Use of the product | Includes electricity, diesel, gasoline | 2009.3781 | 2053.0052 | 2.17% |
| Waste removal | Includes transportation and disposal | 180.6301 | 15.9578 | -91.17% | |
| Total emissions | 3049.3366 | 2,966.0199 | -2.73% | ||
Note: 2022 is used as the base year as it is the first time a Category 3-6 inventory is conducted.
Phihong aligns with the COP26 Climate Summit resolutions to adhere strictly to the 1.5°C pathway. In March 2024, Phihong will achieve validation of its Science-Based Targets initiative (SBTi) for 2030 goals and commits to reaching Net Zero by 2050.


Sustainability Results
- Set the Group’s annual carbon emission reduction target at 4.7% (Scope 1+2, with 2021 as the base year), with
a total emission reduction of 42% by the end of 2030. - GHG (Scope 1+2) reduction of 4,744 tCO2e in 2023, a significant reduction of 16.18% from the base year.
- All models are 100% WEEE compliant with a recyclability rate of >80%, and some models >90%. We continue to
develop and innovate low-carbon products to improve energy conversion efficiency and high-power density. - Report on Disclosure of Climate Change-related Financial Information (TCFD).
- Through the SBTi target setting, we will continue the scientific carbon reduction pathway towards the net-zero goal
in 2050.
Since 2023, Phihong has been planning to implement the ISO 50001 energy management system and intelligent energy management. This initiative aims to monitor energy usage and establish an energy management system. It is expected to complete system implementation and certification by Q4 2024, with the goal of reducing energy consumption through various approaches while also lowering energy costs and carbon emissions.
| Energy category | 2021 | 2022 | 2023 | |||||||
| Taiwan | Dongguan | Haiphong | Taiwan | Dongguan | Haiphong | Linkou HQ | Zerova | Dongguan | Haiphong | |
| Electricity | 9,954 | 107,409 | 17,973 | 11,201 | 100,327 | 38,331 | 5563.6 | 6.436 | 79,840.9 | 49,088 |
| Natural | - | 117 | - | - | 57 | - | - | - | - | - |
| Petrol | - | 5,628 | - | 73.9 | 267 | 130.5 | - | 0.109 | 978.1 | 104.5 |
| Diesel | - | 452 | 32 | 11.75 | 656 | 7.55 | - | - | 40.1 | 104.1 |
| Energy intensity | Unit | 2022 | 2023 | Energy intensity (2023 vs. 2022) | |||
| Dongguan | Haiphong | Dongguan | Haiphong | Dongguan | Haiphong | ||
| Energy | kWh | 27,868,580 | 10,647,384 | 22,178,040 | 13,635,644 | -20.42% | 28.07% |
| Output value | NTD (10k) | 1,015,630 | 236,672 | 463,457 | 228,013 | -54.37% | -2.10% |
| Energy intensity | kWh / 10k NTD | 27.44 | 45.71 | 47.85 | 59.8 | 74.38% | 30.82% |
| PlantType | Unit | Linkou HQ | Zerova | Dongguan | Haiphong | Total | % of each type of energy to total usage |
| Electricity | kWh | 1,545,444 | 1,787,700 | 22,178,040 | 13,635.,644 | 39,146,828 | 96.25% |
| GJ | 5,563.60 | 6,433.00 | 79,840.94 | 49,088.00 | 140,925.54 | ||
| Petrol | L | 3,338.60 | 16,504.69 | 3,006.00 | 22,849.29 | 0.74% | |
| GJ | 0.11 | 978.10 | 104.50 | 1,082.71 | |||
| Diesel | L | 1,115.02 | 2,824.90 | 3,939.92 | 0.10% | ||
| GJ | 40.14 | 104.10 | 144.24 | ||||
| Solar energy | kWh | 32,443.00 | 1,151,493.00 | 1,183,936.00 | 2.91% | ||
| GJ | 116.80 | 4,145.37 | 4,262.17 | ||||
| Total consumption | GJ | 5,563.60 | 6,549.90 | 85,004.56 | 49,296.60 | 146,414.66 | 100.00% |
| Total energy % share | GJ | 3.80% | 4.47% | 58.06% | 33.67% | 100.00% |
Note 1: The heat value and emission coefficient for Taiwan are sourced from the Ministry of Economic Affairs Energy Bureau’s “2019 Electricity Coefficient” published on July 20, 2020. The heat value for purchased electricity is 860 kcal/kWh.
Note 2: The heat value and emission coefficient for China are sourced from the Ministry of Ecology and Environment of China’s “2019 Regional Grid Baseline Emission Factor.” The conversion coefficient for the Southern Region grid is 0.8042
metric tons CO2e/MWh. The emission coefficient for gasoline, diesel, and natural gas is derived from the original IPCC coefficients multiplied by the fuel heat value. The fuel heat values are sourced from the National Standard of the
People’s Republic of China GB/T2589-2008 “General Rules for Calculation of Comprehensive Energy Consumption.” Gasoline has a heat value of 14,110 kcal/L, diesel has a heat value of 10,200 kcal/kg, and natural gas has a heat value
of 8,500 kcal/m3.
Note 3: The heat value and emission coefficient for Vietnam are sourced from the IPCC National Greenhouse Gas Inventory Guidelines (2006) for purchased electricity. The coefficients for gasoline and diesel are sourced from the Cross Sector Tool, with gasoline having a heat value of 0.0447 GJ/kg and diesel having a heat value of 0.0455 GJ/kg.
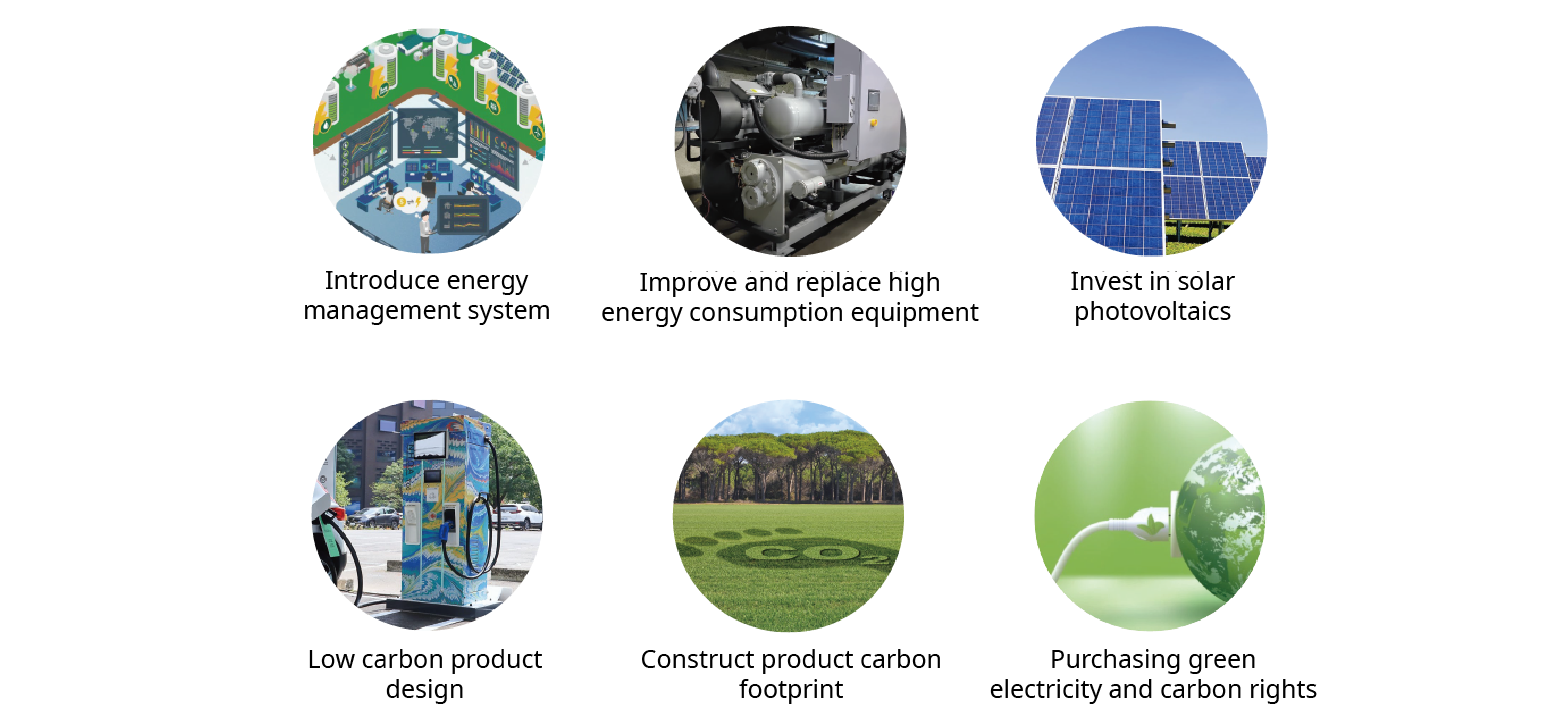
Detailed information on energy-saving plans and carbon reduction projects implemented across all plants in 2023 is provided in the table below:
| Plant | Energy Saving Type | Major Implementation Projects | Investment amount (NTD million) | Implementation Status | Benefits created (actual vs. expected) |
| Linkou HQ | Air Conditioning System | Replace energy consuming 150RT chiller units | 430 | Construction will begin in Q2 of 2023, and it will be officially put into operation in June of the same year. | Expected annual electricity savings are 20,000 kWh (72,000 MJ), resulting in Air Conditioning a yearly reduction of 12.12 metric tons of CO2e emissions. |
| Air Conditioning System | Combine and regulate chilled water piping | 180 | Construction will begin in Q2 of 2023, and it will be officially put into operation in May of the same year. | ||
| Energy saving software | Implement energy management software at Linkou headquarters | 200 | Construction will begin in Q2 of 2023, and it will be officially opened in July of the same year. | Expected annual electricity savings are 10,000 kWh (36,000 MJ), resulting in a yearly reduction of 6.06 metric tons of CO2e emissions. | |
| Zerova | Green power system | Installation of rooftop solar power generation system at Tainan Unit 1 and Unit 3 factories | 2,500 | Based on the revised planning and construction project for the Tainan plant, the original 2023 rooftop solar construction plan has been updated as follows: Phase 1 is scheduled for implementation in 2024, and Phase 3 is scheduled for implementation in 2026. | Expected annual green electricity generation after completion: Phase 1: 366,000 kWh green electricity (1,317,600 MJ), resulting in a yearly reduction of 181 metric tons of CO2e emissions. Phase 3: 467,000 kWh green electricity (1,681,200 MJ), resulting in a yearly reduction of 231 metric tons of CO2e emissions. |
| Energy monitoring | Restoration and addition of power monitoring functions to the energy management platform at Tainan factory | 400 | Based on the re-planning of the Tainan plant area, the original 2023 Phase 1 factory energy management system plan has been updated to be implemented in 2024. | Digitized monitoring of energy management enhances the efficiency of energy use management. | |
| Green building | Planning and construction of Tainan Unit 3 factory according to Diamond-level green building standards | 212 | Confirm with the green building consultant that the project meets the standards, and the engineering unit is conducting an estimate. | Achieving the Diamond-level green building certification is under evaluation for its energy and resource-saving benefits. | |
| Dongguan | Air compressor | Energy-saving renovation plan for air compressor inTiesong Plant | 264 | Construction in December 2023, put into operation in January 2024 | Expected annual energy savings are estimated to reach 400,000 kilowatthours (1.44 million MJ), resulting in a yearly reduction of 228 metric tons of CO2 emissions. |
| Electrical equipment | Energy-saving renovation plan for wind cabinet fans in Tiesong factory area | Energy saving sharing model cooperation | Due to the rearrangement of part of the Tiesong factory area to increase production efficiency, the original planned renovation plan in 2023 has been delayed and is expected to be re-evaluated and planned in 2024. | The target remains to achieve annual energy savings of approximately 200,000 to 250,000 kWh. |
|
| Green power system | Installation of solar power generation systems at phase 1, 2, and 3 of the factory | Energy saving sharing model cooperation | Completed in 2023, the solar power generation systems for Phase 1, 2, and 3 factory buildings were installed and connected to the grid for official power supply. | The expected annual green electricity generation is 2 million kWh (720 million MJ). In 2023, the actual total electricity generated was 1.15 million kWh (414 million MJ), resulting in a yearly carbon reduction of 949.92 metric tons of CO2 equivalent. | |
| Haiphong | Air Conditioning System | The central air conditioning system in the plant uses magnetic bearing chilled water energy-saving air conditioning units. | 2146.36 | Put into use and running | Compared to traditional equipment, the annual energy savings are 1.26 million kWh (453.6 million MJ), resulting in a yearly carbon reduction of 909.8 metric tons of CO2 equivalent. |
| Heat recovery | We chose an energy-saving total heat recovery air conditioning system, which recovers heat energy for domestic hot water use. | 395.35 | Put into use and running | Compared to traditional equipment, the annual energy savings are 2.5 million kWh (9 million MJ), resulting in a yearly carbon reduction of 1,805 metric tons of CO2 equivalent. | |
| Lighting device | LED lighting fixtures are used throughout the entire plant, and solar street lights have been installed. | 206.17 | Put into use and running | Compared to traditional equipment, the annual energy savings are 7.5 million kWh (27 million MJ), resulting in a yearly carbon reduction of 5,416 metric tons of CO2 equivalent. |