Environment
Phihong deeply recognizes the importance of Earth's resources and sustainable development. The company actively promotes environmental management systems and aligns with global carbon reduction trends. Using 2021 as the baseline year, Phihong aims to achieve a 42% reduction in carbon emissions (Scope 1+2) by 2030, working toward net-zero emissions by 2050.
Enhancing Climate Resilience
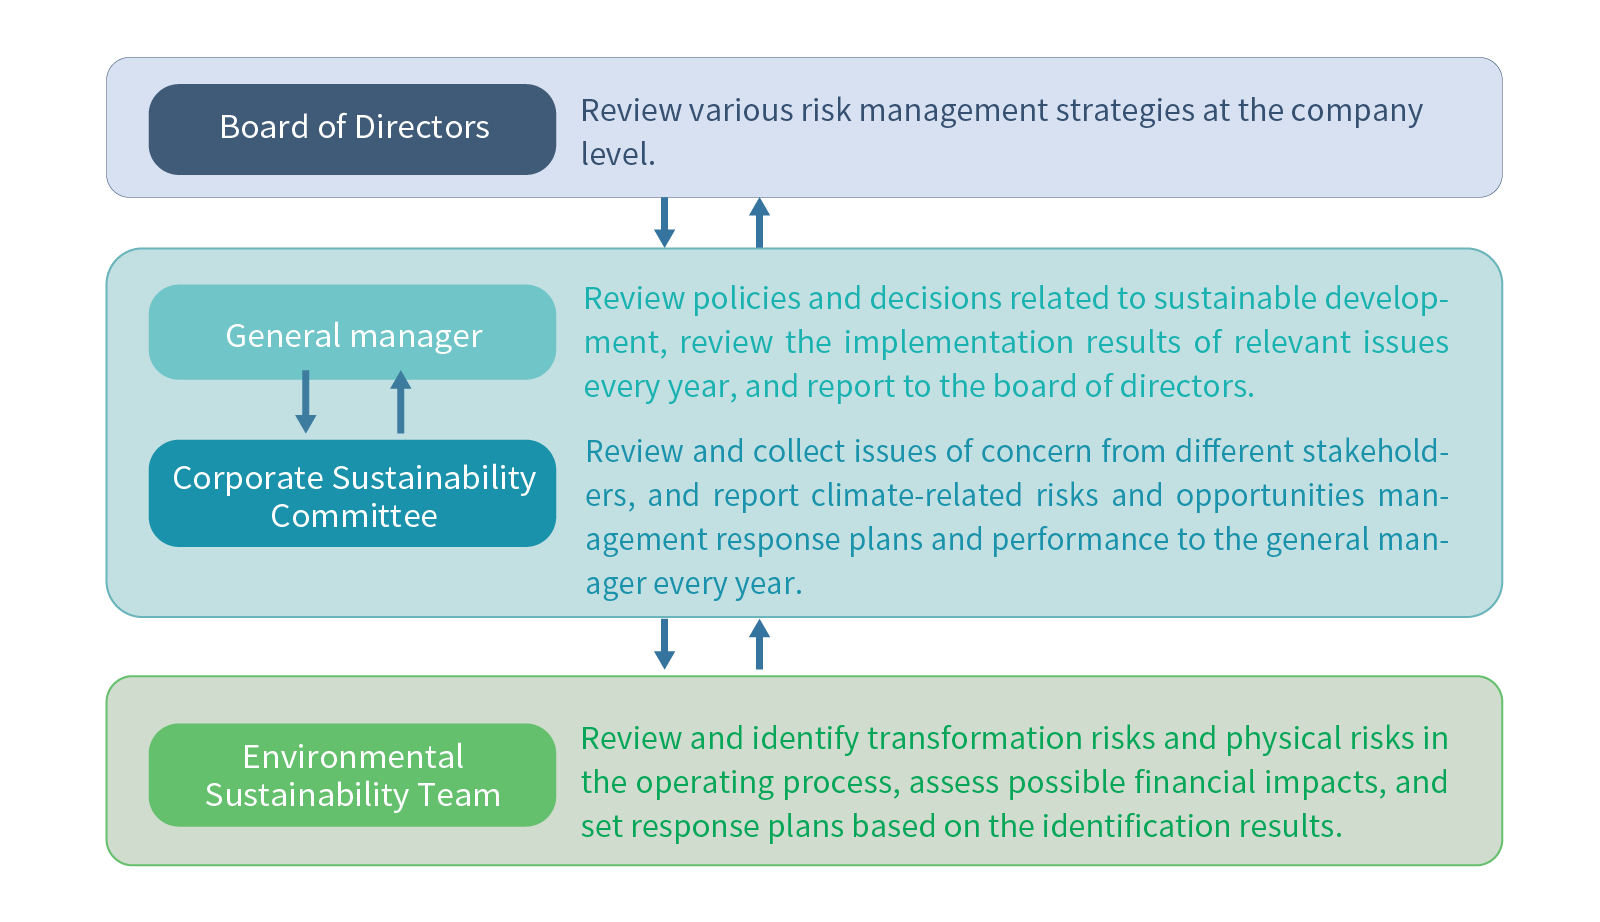
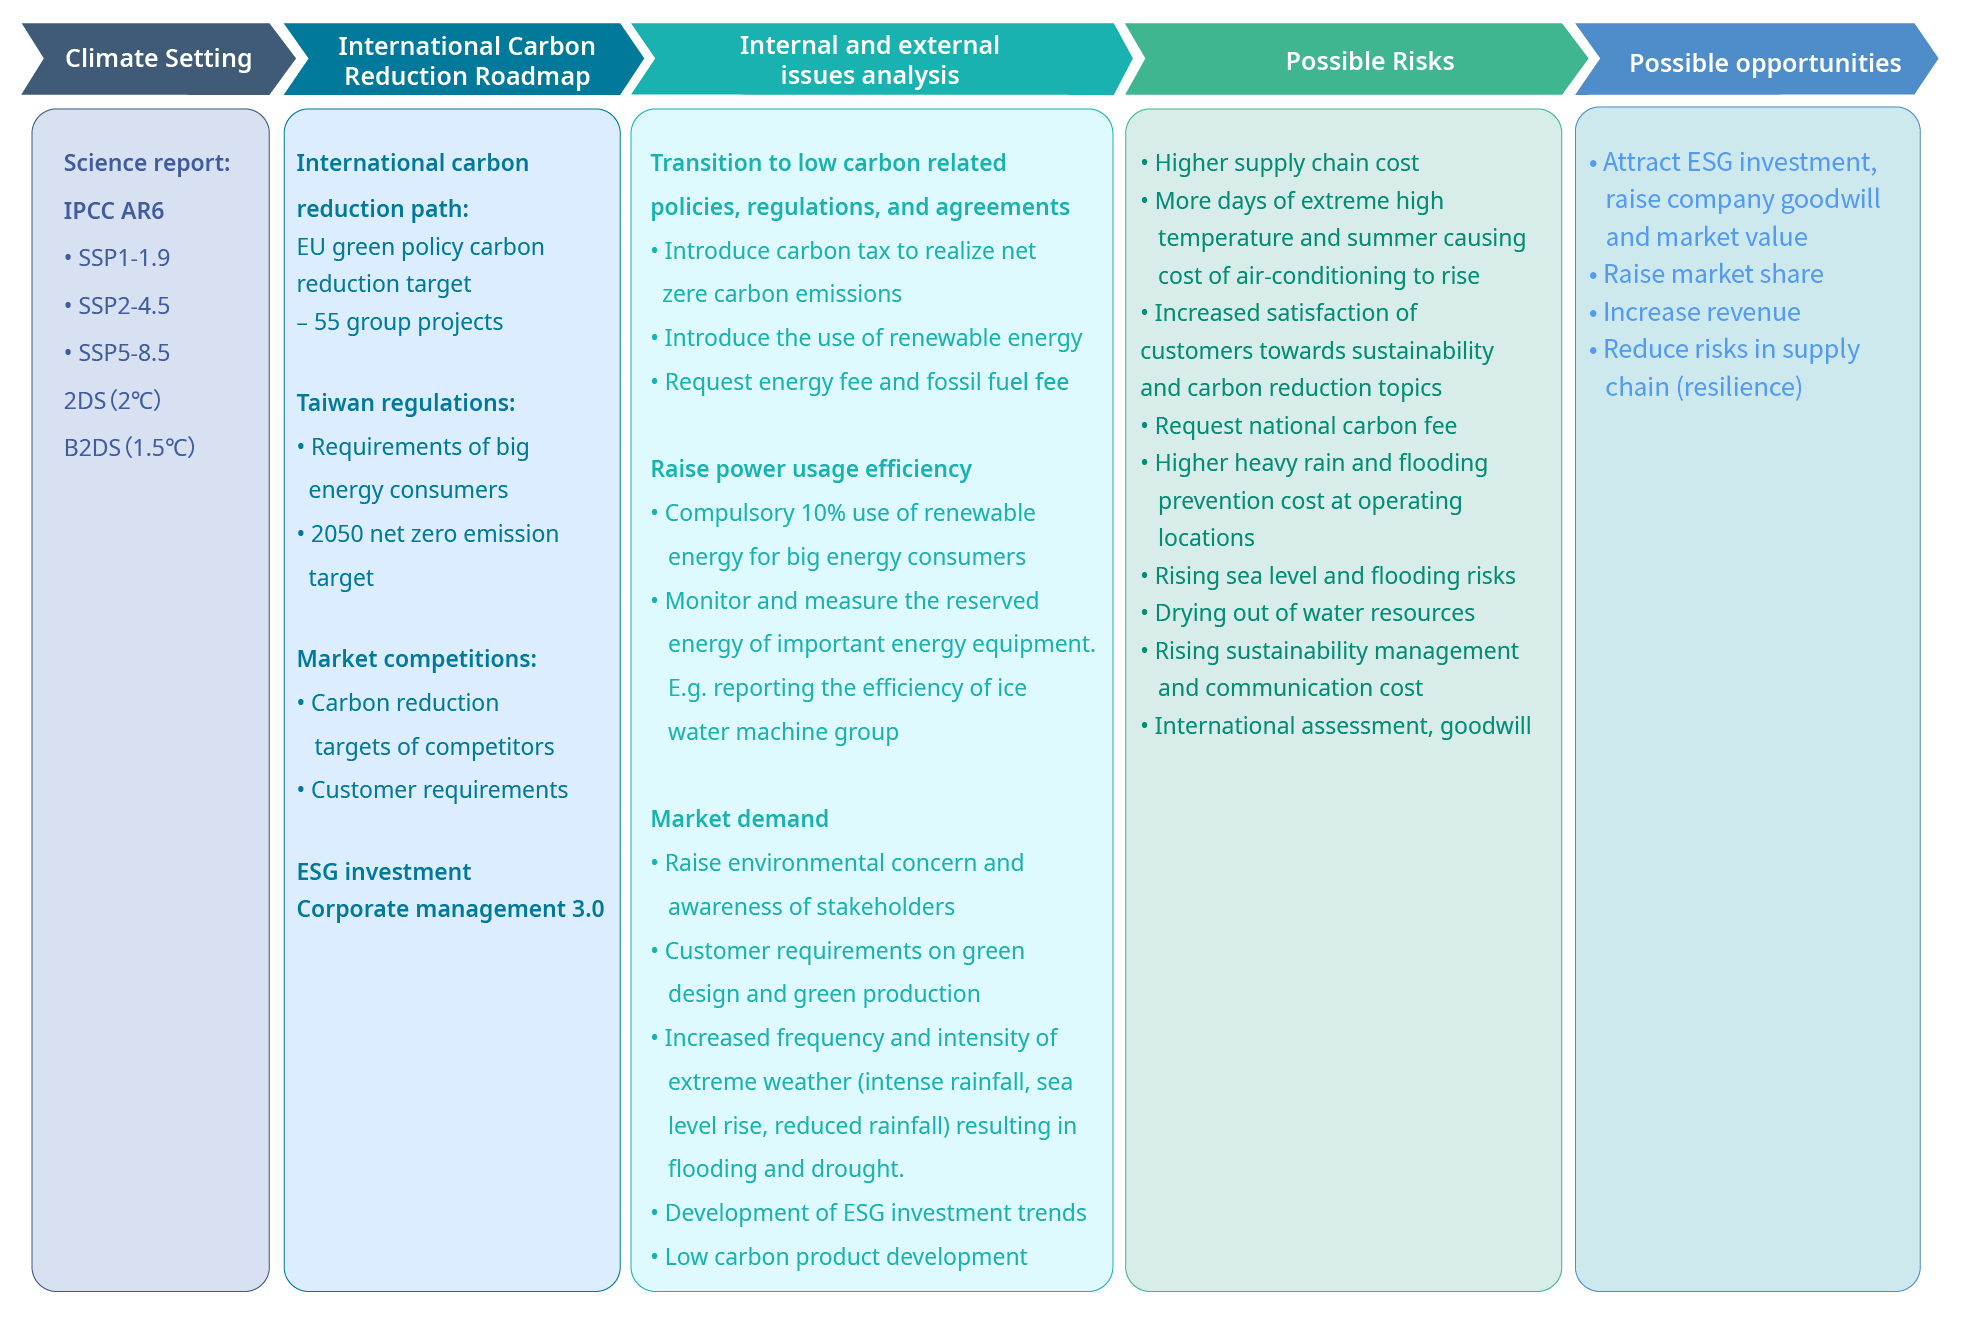
Climate change has significant impacts on the global environment, economy, and society, both now and in the future. It poses substantial risks and opportunities for businesses’ financial aspects. Therefore, it is a key focus strategy in Phihong’s sustainable development. In response to the challenges posed by climate change, Phihong officially signed the support for the Task Force on Climate-related Financial Disclosure (TCFD) in 2022, aligning with international standards. The company continues to establish a comprehensive process for identifying climate change risks and opportunities. By quantifying financial impacts, it gains a clear understanding of the potential effects of climate change risks and opportunities on the company’s operations and strategies. Phihong effectively monitors, controls, and responds to various climate-related topics, seizing opportunities for operational development and innovation. The company also implements sustainable management practices, actively moving towards the goal and vision of transitioning to a low-carbon economy.


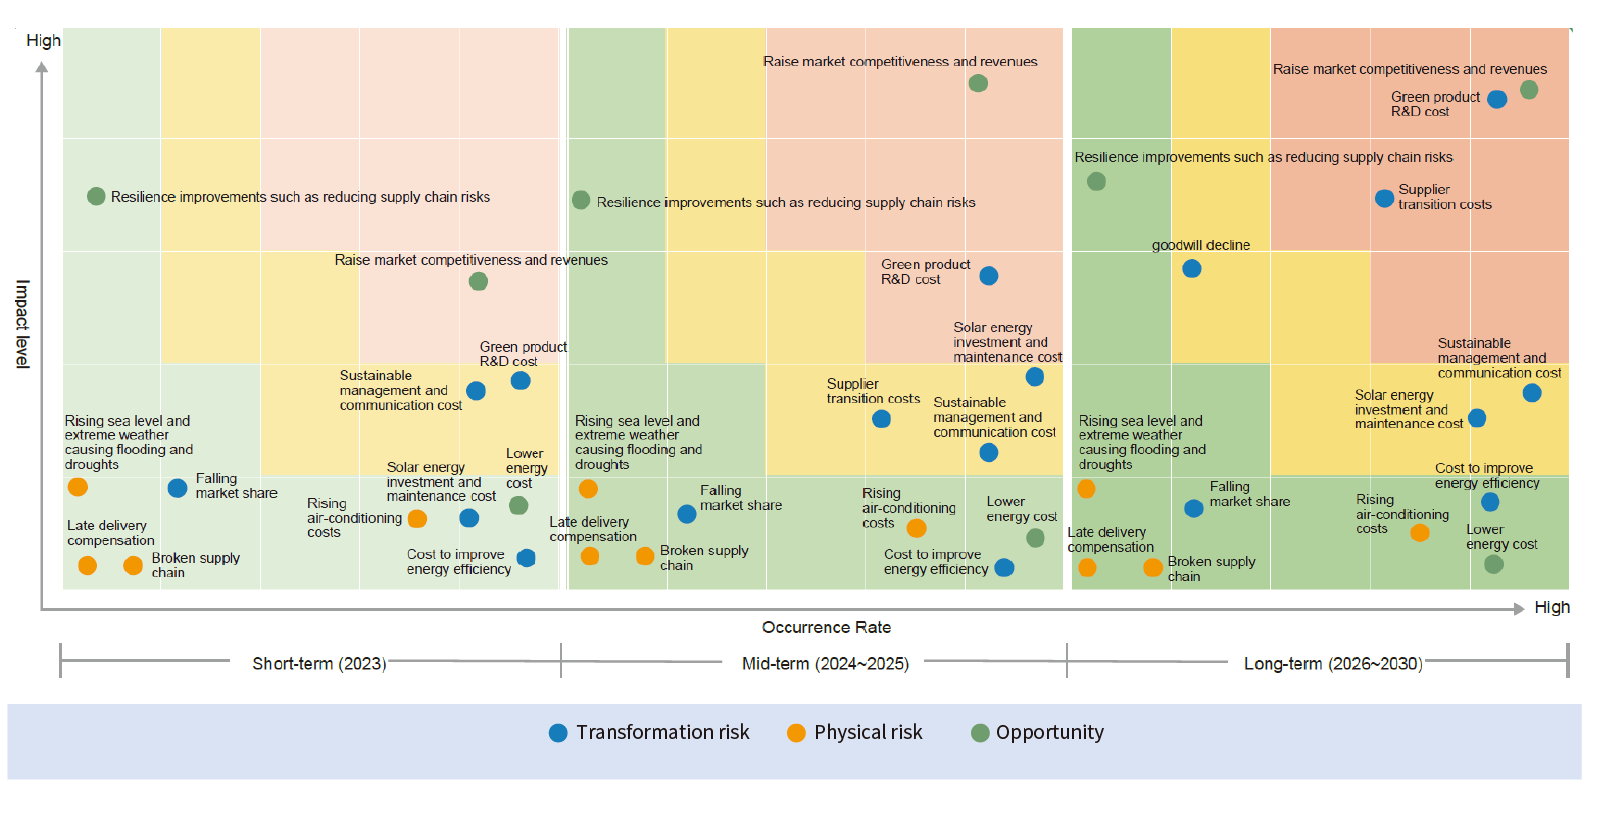
☉ Short-, Mid- and Long-Term Climate Risks and Opportunities Matrix
In this assessment, the short term is defined as 2023, the mid-term as 2024-2025, and the long term as 2026-2030. The potential climate change risks and opportunities are evaluated based on existing measures, scenario simulations, and the intensity of their relevance to determine their impact on operations and probability of occurrence. A risk and opportunity matrix is then created. In the matrix, green areas represent low risk, yellow areas represent moderate risk, and pink-orange areas represent high risk. Based on the scores and timelines of each topic, strategies for addressing risks and opportunities are formulated.
Relevant topics with significant financial impacts:
Short-term: no significant risk topics; Mid-term: investment in research and development costs for green products; Medium-term: investment in research and development costs for greenproducts and transformation costs for suppliers; Short-, mid-, and long-term opportunities are market competitiveness and revenue enhancement.

| Impact Events | Risk Type | Potential Financial Risk | Opportunity Type | Potential Financial Opportunities | Management Measures and Actions |
| Regulatory or agreement requirements | Transformation Risk -Compulsory Acts, Agreements -Technology risk | Laws, policies, reduction targets: • 2050 net zero emission • Corporate governance 3.0 | Improve corporate resilience | Improve the company's ESG performance and market investment value | 1.Implementing an energy management system and installing an energy management platform with monitoring system. Additionally, constructing solar power facilities on the rooftops of our own factories, with Dongguan Phihong's 2,000KWp facility officially operational in 2023. 2. Establishing a TCFD system and implementing dynamic management of short, mid-, and long-term ESG performance (ESG reporting). 3. Actively cooperating with the Financial Supervisory Commission (FSC) to strengthen corporate governance initiatives. 4. Adhering to and disclosing responses to the sustainability disclosure indicators outlined in the "Operation Regulations for Listed Companies to Prepare and Report Sustainability Reports" by the Taiwan Stock Exchange. |
| Supply disruption | Physical Risk -Immediate / long-term | Supply Chain Management: Suspension of raw material supplies, increased sustainable energy costs in the supply chain | Resilience - supply chain risk reduction | Improve supply chain reliability and response resilience | Introduce BCM Management |
| Changing Market Preferences | Transformation Risk -Market -Technology | Changing Market Preferences: Customer demands for green design | • Increase revenue. • Increase market share | Raise customer trust, competitiveness, and operating income | Raise the cost of green product development. |
| Increased severity of extreme weather events such as typhoons and floods | Physical Risk -Immediate / long-term | Impact of Extreme Weather Events: Extreme weather, heavy rainfall, typhoons, etc. cause flooding | Improving the resilience of our own and the supply chain | Insure against related disasters. | |
| Average temperature rise | Physical Risk -Immediate / long-term | Impact of High Temperature: Due to high temperature, the demand for air conditioning in offices and factories increases, which increases power consumption | Introduce an energy management system, namely energy monitoring system, to improve electricity consumption efficiency. Update energy equipment to improve energy efficiency. |
||
| Rainfall (water) pattern changes and climate patterns | Physical Risk -Immediate / long-term | Extreme weather causes drought | No production process uses water, minimal impact. Purchase of drinking water and air conditioning water supply. | ||
| Sea level rise | Physical Risk -Immediate / long-term | Flooding caused by sea level rise | Insure against related disaster risks. |
☉Climate-Related Risks and Opportunities Indicators
To reduce the impact of climate change on operations, Phihong has set green operation targets, and carried out strategic planning and target setting on projects such as energy conservation and carbon reduction, water conservation and waste management. The achievement is reviewed every year to further develop improvement plans.
| Actual Result in 2023 | Short-term (2024-2025) | Mid to Longterm (2026-2030) |
|
| Electricity saving rate (%) over base year 2021 | -3.8% | -4.5% | -4.5% |
| Renewable Energy Buildings (cumulative kW) | 2,000kW | 1,000kW | 6,000kW |
| Water Consumption per Capita (Million Liters/capita) | 0.0947 | 0.0900 | 0.0855 |
| Water Conservation Rate (%) in the plant area over the base year 2021 | 5% | 5% | 5% |
| General Waste Unit Revenue Generation (Tons/Million) | 0.1415 | 0.1344 | 0.1277 |